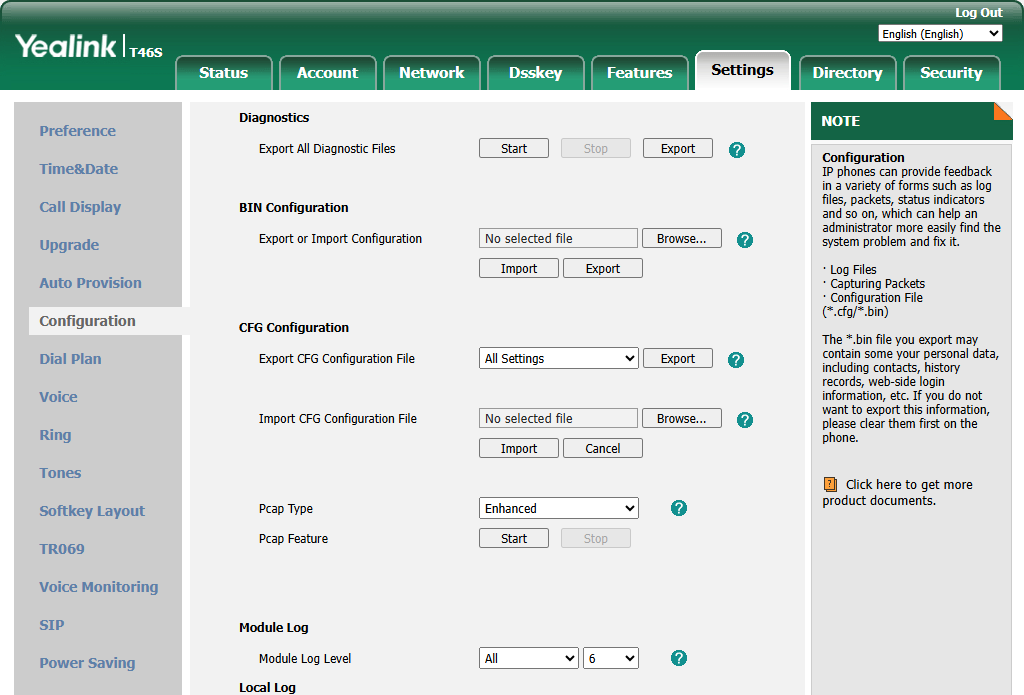

How to perform a trace from a Yealink device
In order to capture issues on a device, it is possible to start a trace directly from the Yealink device itself. Traces made from the device itself often provide more detailed information about the possible causes than when a trace is made from the Kwebbl servers.
There are two different traces:
Normal: Capture all SIP Signalling from the device.
Exchanged: Capture all SIP Signalling and audio from the device.
After the trace is performed, the file can be opened in 'Wireshark'.
SIP Signalling trace
If you want to capture all SIP signalling from a device in order to find any issues, you can easily start a trace from the device. This type of trace can be used to check:
BLF status update
Registration
SIP handling / flows on calls
Please follow the steps below to perform a trace without audio:
Log in to the device, e.g., 192.168.1.10.
Go to 'Configuration'.
Set 'PCAP Type' to 'Normal'.
Click on 'Start'.
Try to reproduce the issue on the device.
Click on 'Stop' to stop the trace after reproducing the issue.
Click on 'Export' to save the trace.
SIP Signalling trace including audio
In case a customer experiences audio issues, you can perform an Enhanced trace from the device. With this trace, all audio is captured and can be listened to in Wireshark. Please follow the steps below to perform the trace:
Log in to the device, e.g., 192.168.1.10.
Go to 'Configuration'.
Set 'PCAP Type' to 'Enhanced'.
Click on 'Start'.
Try to reproduce the issue on the device.
Click on 'Stop' to stop the trace after reproducing the issue.
The trace is automatically saved in your downloads folder.
